Biogas Market

Key Players: EnviTec Biogas AG, Weltec Biopower GmbH, PlanET Biogas Global GmbH, BTS Biogas Srl, Hitachi Zosen Inova AG, Air Liquide S.A., Gasum Oy, Nature Energy (Shell)

Biogas Market

Biogas Market Research Report By Application (Electricity Generation, Transportation Fuel, Heating Applications, Fertilizer Production), By Feedstock (Agricultural Waste, Municipal Solid Waste, Animal Manure, Industrial Waste), By Technology (Anaerobic Digestion, Landfill Gas Recovery, Gasification), By End Use (Residential, Commercial, Industrial) and By Regional (North America, Europe, South America, Asia Pacific, Middle East and Africa) - Growth & Industry Forecast to 2035
ID: MRFR/EnP/9441-HCR
128 Pages
Chitranshi Jaiswal
Last Updated: June 22, 2026

Biogas Market Summary

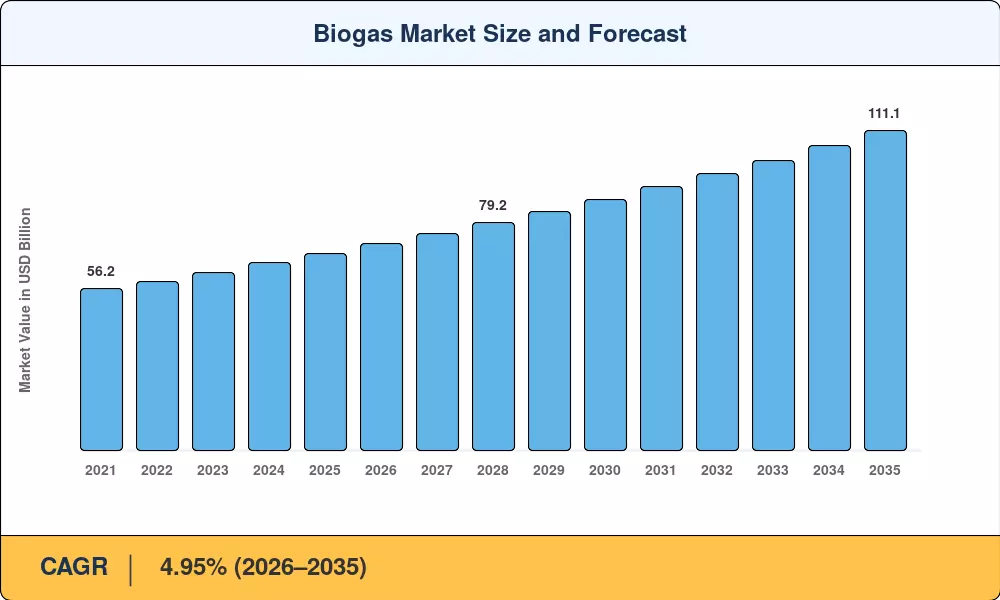
The global Biogas Market was valued at USD 68.5 billion in 2025 and is projected to grow from USD 71.9 billion in 2026 to USD 111.1 billion by 2035, registering a CAGR of 4.95% during the forecast period (2026–2035). Strengthening renewable fuel mandates and accelerating corporate net-zero timelines are channeling fresh capital into anaerobic digestion infrastructure across every major geography. The European Commission's revised Renewable Energy Directive (RED III), which sets binding biomethane blending targets for gas grid operators, exemplifies the policy tailwinds underpinning this expansion [1].

A structural shift is underway within the Biogas Market as operators move beyond electricity-only generation toward upgraded renewable natural gas (RNG) suitable for pipeline injection and transport fuel use. The U.S. Environmental Protection Agency's Renewable Fuel Standard (RFS) program allocated over USD 7.2 billion in compliance credits to biogas-derived RNG producers between 2022 and 2024, incentivizing dairy farms and food-waste processors to invest in gas-upgrading equipment [2]. This pivot from power-only to multi-product plants is raising average project IRRs by 3–5 percentage points.

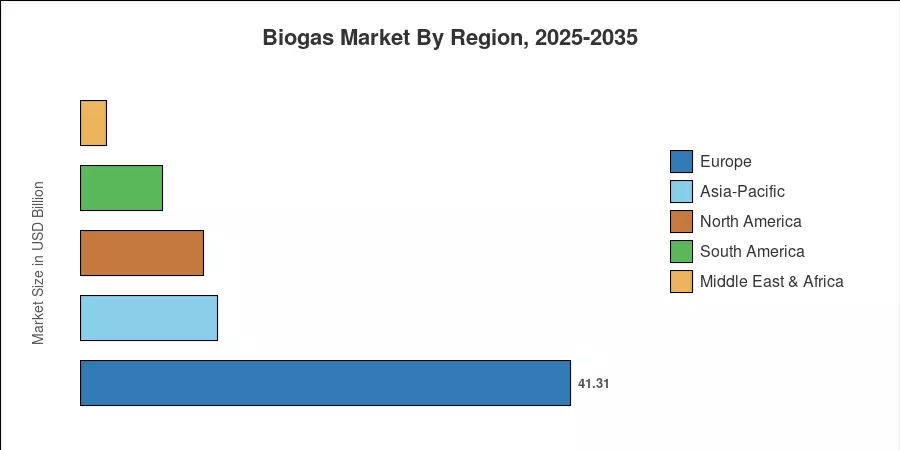
Europe commands a 60.3% share of the Biogas Market, driven by Germany's 11,000-plus operational plants and expanding grid-injection capacity across Scandinavia and the Netherlands [3]. South America is the fastest-growing region at a projected 10.15% CAGR through 2035, fueled by Brazil's RenovaBio decarbonization credit system. Asia-Pacific holds the second-largest position with a 16.8% share, led by China's rural digester modernization campaign. The next decade will reward players who combine feedstock aggregation with carbon-credit monetization and dispatchable grid services.

Key Report Takeaways

• By Feedstock

  • Livestock manure accounted for 40.0% of the Biogas Market in 2025, reflecting the large installed base of agricultural digesters across Europe and North America.
  • Food and beverage waste is expanding at a 7.65% CAGR through 2035, driven by landfill diversion mandates and tipping-fee economics that favor anaerobic processing.

• By Process Technology

  • Wet anaerobic digestion represented 63.5% of global installations in 2025, remaining the default technology for liquid-heavy feedstocks.
  • Dry anaerobic digestion systems are posting the highest projected CAGR at 8.10% through 2035, attracting investment in regions with abundant crop residue supply.

• By Application

  • Electricity generation led the Biogas Market with a 54.9% application share in 2025.
  • Vehicle fuel and RNG applications are forecast to grow at a 9.20% CAGR, supported by transport decarbonization policies.

• By Region

  • Europe held 60.3% of the Biogas Market share in 2025, anchored by feed-in tariff regimes.
  • South America is the fastest-growing region at a 10.15% CAGR through 2035.

Market Size and Forecast (2021–2035)

The figures below are derived from a proprietary estimation framework combining bottom-up plant-capacity modeling, feedstock-availability analysis, and top-down cross-referencing with government registry data and industry association statistics. Historical values (2021–2024) reflect audited installations and revenue disclosures, while forecast projections (2026–2035) apply scenario-weighted CAGR modeling.

Biogas Market Size and Forecast
Our Impact
Enabled $4.3B Revenue Impact for Fortune 500 and Leading Multinationals
Partnering with 2000+ Global Organizations Each Year
30K+ Citations by Top-Tier Firms in the Industry

Driver Impact Analysis

Driver ~% Impact on CAGR Geographic Relevance Impact Timeline
Renewable fuel mandates and blending targets +1.2% Europe, North America Short-term (≤2 yr)
Carbon-credit and offset monetization +0.9% Global Medium-term (2–4 yr)
Landfill diversion and organic-waste bans +0.7% North America, Europe Short-term (≤2 yr)
Corporate decarbonization and Scope 3 commitments +0.6% Global Medium-term (2–4 yr)
Grid-balancing demand for dispatchable renewables +0.5% Europe, Asia-Pacific Long-term (≥4 yr)
Rural electrification through distributed biogas +0.4% Asia-Pacific, Africa Long-term (≥4 yr)
Transport sector RNG adoption +0.3% North America, South America Medium-term (2–4 yr)


Renewable Fuel Mandates and Blending Targets

By 2030, the EU's REPowerEU plan aims to produce 35 billion cubic meters of biomethane, up from about 3.5 billion cubic meters in 2022. This tenfold increase is mobilizing an estimated EUR 37 billion in cumulative capital expenditure across member states [1]. The Renewable Energy Sources Act (EEG 2023) was changed in Germany to increase tariff bands for new facilities that pump upgraded gas directly into the grid and to extend feed-in bonuses for existing plants. In the US, new project applications submitted to USDA's Rural Energy for America Program have increased by 22% year over year as a result of the Inflation Reduction Act's investment tax credits for biogas projects, which have shortened effective payback periods by 18–24 months [2].


Carbon-Credit and Offset Monetization

Voluntary carbon markets valued biogas-derived methane-avoidance credits at USD 18–42 per tonne CO₂e throughout 2024, with dairy-manure projects commanding premiums due to their verifiable additionality under Verra and Gold Standard protocols [8]. California's Low Carbon Fuel Standard (LCFS) assigns biogas-derived RNG a carbon-intensity score as low as negative 300 gCO₂e/MJ when sourced from dairy waste, creating per-gallon-equivalent credit values that frequently exceed the commodity price of the gas itself. This carbon-stacking effect is transforming project finance structures across the Biogas Market, with developers securing offtake agreements indexed to credit markets rather than spot gas prices [10].

Landfill Diversion and Organic-Waste Bans

Over 25 U.S. states now enforce or are phasing in organic-waste diversion mandates — California's SB 1383 alone requires a 75% reduction in organic-waste landfilling by 2025 relative to 2014 levels [9]. The diverted feedstock is increasingly channeled to anaerobic digestion facilities rather than composting operations because digestion yields both energy revenue and nutrient-recovery income. In France, the Anti-Food-Waste Law obliges large food retailers to contract with biogas operators for unsold inventory processing, creating a guaranteed feedstock pipeline estimated at 1.2 million tonnes annually.

Grid-Balancing Demand for Dispatchable Renewables

As solar and wind penetration passes 40% of installed capacity in markets like Germany, Denmark, and parts of Australia, grid operators face growing intermittency challenges. Biogas-fueled combined heat-and-power (CHP) plants offer dispatchable generation that can ramp within minutes, a capability valued at EUR 15–25/MWh above baseload tariffs in several European balancing markets [11]. IRENA estimates that 12 GW of additional dispatchable biogas capacity will be required globally by 2030 to complement variable renewable expansion without increasing fossil-gas reliance.

Restraints Impact Analysis

Restraint ~% Impact on CAGR Geographic Relevance Impact Timeline
High upfront capital costs for digester systems –0.6% Global Short-term (≤2 yr)
Feedstock supply-chain fragmentation –0.4% Asia-Pacific, Africa Medium-term (2–4 yr)
Permitting and environmental compliance delays –0.3% North America, Europe Short-term (≤2 yr)
Competition from solar and wind for subsidy allocation –0.3% Global Long-term (≥4 yr)
Digestate disposal and nutrient-management regulations –0.2% Europe Medium-term (2–4 yr)


High Upfront Capital Costs

A typical 1 MW wet anaerobic digestion plant requires USD 4–7 million in capital expenditure, excluding grid-connection infrastructure and gas-upgrading equipment [13]. In developing economies where project finance mechanisms remain underdeveloped, these costs create a significant barrier to entry. Although feed-in tariffs and tax credits can reduce effective payback periods to 5–7 years in mature markets, smaller agricultural operators frequently lack the balance-sheet capacity or credit history to secure favorable debt terms, limiting the Biogas Market's penetration among mid-tier farms.

Feedstock Supply-Chain Fragmentation

Reliable feedstock aggregation is the operational backbone of any biogas facility, yet supply chains in emerging markets remain highly fragmented. In India, for instance, agricultural residue collection depends on informal networks that introduce seasonal variability of 20–30% in delivered tonnage [14]. This inconsistency depresses annual methane yields below design specifications, eroding investor confidence and lengthening payback horizons.

Permitting and Environmental Compliance Delays

Under state-level CEQA or NEPA-equivalent frameworks, the environmental review process for a new biogas plant in the US usually takes 12 to 24 months [15]. Due to heightened scrutiny of the effects of odour and noise, Germany's Bundesimmissionsschutzgesetz (Federal Immission Control Act) authorization timelines have been extended by an average of six months since 2021. Particularly for smaller developers running the expanding sub-0.5 MW portion of the biogas market, these delays shorten development timetables and raise carrying costs.


Biogas Market Opportunities

RNG Pipeline Injection at Scale

The biomethane upgrading technology needed to bring raw biogas to pipeline-quality specifications has matured rapidly, with membrane separation and pressure-swing adsorption systems achieving methane purity above 97% at declining per-unit costs. Utilities in the Netherlands, Denmark, and California are now accepting upgraded RNG on long-term offtake contracts indexed to natural-gas hub pricing plus a green premium of 15–30%.

Emerging-Market Leapfrogging Through Modular Systems

Containerized, plug-and-play digester units rated at 50–250 kW are enabling rapid deployment in Sub-Saharan Africa and Southeast Asia without the civil-engineering timelines associated with conventional concrete-tank plants. Kenya's National Biogas Programme has installed over 22,000 household and institutional digesters since 2020, and modular commercial systems are now targeting agro-industrial clusters in Vietnam and the Philippines [12].

Carbon-Credit Stacking and Revenue Diversification

Biogas operators can now layer multiple revenue streams — electricity sales, RNG commodity revenue, LCFS or ETS carbon credits, digestate fertilizer sales, and tipping fees — to build projects with blended IRRs of 14–18%. This multi-revenue architecture is attracting infrastructure-grade investors to the Biogas Market, including pension funds and sovereign wealth vehicles that previously avoided single-commodity renewable plays.

Data-Driven Yield Optimization and Digital Business Models

Digester methane yields are increasing by 5–10%, and unexpected downtime is decreasing by up to 30% thanks to real-time monitoring platforms that use IoT sensors and machine-learning algorithms. SaaS-based plant management tools are becoming a new business model, with operators paying monthly subscription fees of EUR 2,000–5,000 for automated feed-rate optimization and predictive-maintenance analytics.


Hydrogen Blending and Power-to-Gas Integration

Several pilot projects in Germany and Japan are coupling biogas plants with electrolyzers to produce bio-hydrogen blends or to use surplus renewable electricity for biological methanation, converting CO₂ in raw biogas into additional methane. The IEA estimates that power-to-gas integration could increase a standard biogas plant's output by 25–40% without requiring additional feedstock.

Biogas Market Future Outlook

AI-Driven Plant Operations and Autonomous Digester Management

Artificial intelligence is poised to reshape Biogas Market operations by enabling autonomous feed-rate adjustment, real-time pH and volatile-fatty-acid monitoring, and predictive equipment-failure detection. estimates that AI-optimized biogas plants achieve 8–12% higher methane yields than manually operated peers, translating to USD 300,000–600,000 in additional annual revenue for a typical 2 MW facility [20]. By 2030, over 40% of new installations are expected to deploy some form of automated process control.

Platform Economics and Feedstock Aggregation Marketplaces

Digital platforms connecting waste generators with biogas plant operators are emerging across Europe and North America, reducing feedstock procurement costs by 10–15% through transparent bidding and logistics optimization. These marketplace models convert fragmented organic-waste streams into tradable commodities, improving capacity utilization for the Biogas Market and lowering gate fees for waste producers simultaneously [21].

Electrification Supercycle and Sector Coupling

The convergence of biogas with power-to-gas and green-hydrogen production represents a significant expansion pathway. IRENA projects that 18 GW of electrolyzer capacity will be coupled with biogas facilities by 2035, enabling operators to absorb surplus renewable electricity and convert it into storable methane [22]. This sector-coupling approach positions biogas plants as flexible grid assets capable of providing both power and gas on demand.

ESG Reporting Mandates and Institutional Capital Inflows

Large companies are being forced to measure Scope 3 emissions throughout supply chains by the SEC's proposed climate-disclosure regulations and the EU's Corporate Sustainability Reporting Directive (CSRD) [10]. Industrial consumers can claim quantifiable Scope 1 and Scope 2 reductions when biogas-derived energy is confirmed with chain-of-custody proof. Since 2022, infrastructure funds run by BlackRock, Macquarie, and Brookfield have allotted more than USD 4 billion to biogas and biomethane assets, indicating a persistent institutional interest in the biogas market [23].


Biogas Market Segmentation

By Feedstock

Segment Key Metric Primary Demand Driver
Livestock Manure 40.0% share (2025) Agricultural digester installed base
Food and Beverage Waste 7.65% CAGR (2026–2035) Landfill diversion mandates
Agri Residues USD 13.2B (2025) Crop-stubble burning bans in Asia
Other Feedstocks 4.80% CAGR (2026–2035) Sewage sludge and industrial organics


Livestock manure retains the largest feedstock share in the Biogas Market because dairy and swine operations generate consistent year-round substrate volumes with well-characterized methane potential. European co-digestion plants frequently blend manure with energy crops and food waste to optimize C: N ratios and boost gas yields by 20–35% above mono-digestion baselines. Food and beverage waste is the fastest-expanding feedstock category, propelled by municipal organic-waste collection mandates now active in over 30 countries [9]. Processing tipping fees of USD 40–80 per tonne provides operators with a revenue stream before any gas or electricity sales begin.

By Process Technology

Segment Key Metric Primary Demand Driver
Wet Anaerobic Digestion 63.5% share (2025) Established technology for liquid-heavy substrates
Dry Anaerobic Digestion 8.10% CAGR (2026–2035) Crop residue and municipal solid waste suitability
Landfill Gas Recovery USD 7.8B (2025) Regulatory closure of uncontrolled emissions


Wet anaerobic digestion dominates the Biogas Market's technology landscape, handling feedstocks with moisture content above 80% in continuously stirred tank reactors (CSTRs) that benefit from decades of operational know-how. Dry systems — operating at 20–40% total solids — are gaining traction in southern Europe and Southeast Asia, where crop residues and yard waste represent the primary available substrates. Dry-batch tunnel systems require 40–50% less water than wet alternatives, a decisive advantage in water-scarce regions.

By Plant Capacity

Segment Key Metric Primary Demand Driver
Below 0.5 MW 8.60% CAGR (2026–2035) Community-scale distributed generation incentives
0.5 to 2 MW 47.5% share (2025) Mid-scale agricultural and municipal projects
Above 2 MW USD 11.9B (2025) Centralized co-digestion hubs, industrial waste


The 0.5–2 MW segment accounts for the Biogas Market's largest capacity share, reflecting its suitability for medium-sized dairy operations, municipal wastewater treatment plants, and food-processing facilities. Sub-0.5 MW community plants are the fastest-growing capacity tier as distributed-generation incentive schemes in Germany, Italy, and Japan reduce grid-connection barriers and offer preferential feed-in tariffs to small producers.

By Application

Segment Key Metric Primary Demand Driver
Electricity Generation 54.9% share (2025) Feed-in tariffs and CHP incentives
Heat Generation USD 9.4B (2025) District heating integration in Northern Europe
Vehicle Fuel / RNG 9.20% CAGR (2026–2035) Transport decarbonization mandates
Other Applications 3.90% CAGR (2026–2035) Industrial process heat, cooking fuel


Electricity generation remains the Biogas Market's primary end use, particularly in Germany and Italy, where CHP plants operate under guaranteed tariff structures. Vehicle fuel and RNG represent the fastest-growing application as transport-sector policies — including the EU's Alternative Fuels Infrastructure Regulation and California's LCFS — create premium pricing for low-carbon gaseous fuels. RNG producers in California earned an average all-in revenue of USD 35–45 per MMBtu in 2024, compared with USD 2–3 per MMBtu for conventional natural gas [2].

Regional Market Share Analysis

Region Key Metric Primary Investment Themes
North America 15.2% share (2025) RNG upgrading, dairy-waste monetization, and LCFS credits
Europe 60.3% share (2025) Grid injection, REPowerEU biomethane targets
Asia-Pacific 16.8% share (2025) Rural electrification, industrial waste processing
South America 10.15% CAGR (2026–2035) RenovaBio credits, sugarcane vinasse processing
Middle East & Africa 3.2% share (2025) Off-grid power, municipal waste management
Total USD 68.5 Billion (2025)

The Biogas Market exhibits a concentrated geographic footprint, with Europe's extensive feed-in tariff infrastructure and mandatory grid-injection programs sustaining its dominant position. South America and the Asia-Pacific are the primary growth vectors, driven by agricultural waste abundance and newly enacted policy incentives.


North America

Country Key Metric Key Driver
United States 72.4% of regional share LCFS credits, RFS compliance, dairy RNG
Canada 16.5% of regional share Provincial carbon pricing, organic-waste bans
Mexico 5.85% CAGR (2026–2035) Agro-industrial waste, energy reform incentives


The U.S. remains the engine of North American biogas investment, with over 2,300 operational systems processing livestock manure, food waste, and wastewater biosolids [2]. California's LCFS credit prices averaged USD 72 per tonne in 2024, making dairy-RNG projects among the highest-return renewable investments in the country. Canada's Clean Fuel Regulations, effective since July 2023, add a parallel compliance demand for low-carbon gaseous fuels.

Europe

Country Key Metric Key Driver
Germany 34.8% of regional share Largest installed base, EEG tariff extensions
United Kingdom 6.95% CAGR (2026–2035) Green Gas Support Scheme, food-waste mandates
France 11.2% of regional share Agriculture-driven methanization strategy
Italy 8.7% of regional share Upgraded biomethane for transport incentives
Spain 6.20% CAGR (2026–2035) PNIEC national energy plan targets
Nordic Countries 9.4% of regional share District heating integration, cross-border gas trading
Russia 2.1% of regional share Large-scale landfill-gas recovery potential
Rest of Europe 5.45% CAGR (2026–2035) Eastern European capacity build-out


Germany's Biogas Market accounts for more than one-third of all European installed capacity, though annual capacity additions have slowed as legacy plants approach tariff-expiry cliffs. France is accelerating rapidly under its Plan Biogaz, targeting 6 TWh of biomethane injection by 2028. The UK's Green Gas Support Scheme, launched in 2022, guarantees quarterly tariff payments for biomethane producers injecting into the National Transmission System, drawing participation from 85 new projects in its first two years [3].

Asia-Pacific

Country Key Metric Key Driver
China 38.2% of regional share Rural digester modernization, waste-to-energy policy
India 7.80% CAGR (2026–2035) The SATAT scheme compressed biogas targets
Japan 14.5% of regional share Waste reduction, carbon neutrality by 2050
South Korea 6.40% CAGR (2026–2035) Food-waste recycling mandates
ASEAN 7.15% CAGR (2026–2035) Palm-oil-mill effluent treatment, rural energy
Rest of Asia-Pacific 11.3% of regional share Mixed early-stage adoption


China operates the world's largest fleet of household-scale digesters — an estimated 40 million units — though the government is now prioritizing medium-scale centralized facilities processing 50–200 tonnes of organic waste per day [12]. India's SATAT initiative targets 5,000 compressed biogas plants by 2028, backed by guaranteed offtake pricing and viability-gap funding. Japan channels strict food-waste recycling laws into high-efficiency thermophilic digestion systems.

South America

Country Key Metric Key Driver
Brazil 68.5% of regional share RenovaBio credits, sugarcane vinasse, swine waste
Argentina 7.50% CAGR (2026–2035) Cattle industry waste, PROBIOMASA program
Rest of South America 5.8% CAGR (2026–2035) Emerging agricultural biogas programs


Brazil's RenovaBio credit trading system, fully operational since 2020, assigns decarbonization credits (CBIOs) to certified biofuel producers, creating a direct revenue incentive for biogas-to-RNG projects. The country's vast sugarcane and swine-farming sectors generate feedstock volumes sufficient to support an estimated 1,800 additional commercial biogas plants [18]. Argentina's PROBIOMASA program, backed by FAO technical assistance, is developing regional biogas clusters across the Pampas.

Middle East & Africa

Country Key Metric Key Driver
Saudi Arabia 3.1% of regional share Municipal solid waste management plans
UAE 5.10% CAGR (2026–2035) Circular-economy mandates, food-waste processing
South Africa 31.4% of regional share Independent power producer framework
Egypt 6.25% CAGR (2026–2035) Agricultural residue from Nile Delta farming
Rest of MEA 4.50% CAGR (2026–2035) Off-grid solutions, municipal waste pilots


South Africa leads the MEA region's Biogas Market through its Renewable Energy Independent Power Producer Procurement Programme (REIPPPP), which has awarded multiple biogas concessions since Round 5. The UAE's Ministry of Climate Change and Environment has mandated food-waste segregation in commercial establishments, channeling an estimated 1.5 million tonnes of organic waste annually toward anaerobic digestion [19].

Biogas Market By Region, 2025-2035

Competitive Benchmarking

The Biogas Market remains fragmented, with an estimated Herfindahl-Hirschman Index (HHI) below 600 and the top five players collectively holding approximately 22–28% revenue share. Competition spans vertically integrated EPC firms, technology licensors, project developers, and utility-backed platforms. Established integrators defend share through self-funded capacity expansion, while challengers pursue modular upgrading units and carbon-capture add-ons to differentiate offtake economics.

Company Est. Revenue Share Range Key Offerings for the Biogas Market Strategic Positioning
EnviTec Biogas AG ~5–8% Turnkey plant construction, O&M, own-and-operate Vertically integrated developer-operator
Weltec Biopower GmbH ~3–5% Stainless-steel digester systems, international EPC Mid-scale agricultural and industrial plants
PlanET Biogas Global GmbH ~3–5% Modular plant design, feedstock consulting Technology-led project delivery
BTS Biogas Srl ~2–4% Compact digester systems, Southern European focus Regional specialization in Mediterranean climates
Hitachi Zosen Inova AG ~3–5% Large-scale waste-to-energy, dry digestion Industrial and municipal anchor projects
Air Liquide S.A. ~4–6% Gas upgrading, biomethane purification, and distribution Downstream gas-processing expertise
Gasum Oy ~2–4% Nordic biomethane production, LNG-LBG logistics Integrated gas supplier for the transport sector
Nature Energy (Shell) ~3–5% Large-scale centralized co-digestion hubs Utility-backed capital and offtake integration
Scandinavian Biogas Fuels International AB ~2–3% Upgrading plant operations, municipal partnerships Public-private partnership model
Agrinz Technologies GmbH ~1–3% Small-scale agricultural digesters, automation Farm-scale turnkey solutions


Recent News & Developments

  • EnviTec Biogas AG (March 2025): Commissioned a 5.2 MW co-digestion facility in Lower Saxony processing 120,000 tonnes/year of food waste and cattle slurry, the company's largest single-site installation to date [6].
  • European Commission (January 2025): Published implementing rules for the Biomethane Industrial Partnership, targeting 35 bcm of EU biomethane production by 2030 and unlocking EUR 18 billion in anticipated private investment [1].


  • U.S. Department of Agriculture (September 2024): Awarded USD 128 million in grants under the Rural Energy for America Program to 47 biogas and RNG projects across 19 states [2].
  • Air Liquide (June 2024): Signed a 15-year biomethane offtake agreement with a French agri-cooperative consortium, securing 40 GWh/year of pipeline-quality gas production [7].


  • Hitachi Zosen Inova (January 2024): Completed integration of dry-digestion technology from its Kompoferm acquisition, deploying the first combined wet-dry anaerobic system at a Swiss municipal waste facility [15].
  • Brazil's ANP (October 2023): Certified 42 new biomethane producers under the RenovaBio program, doubling the country's registered biogas-to-RNG capacity in a single year [18].

Biogas Market Report Scope

Parameter Detail
Market Scope Global Biogas Market covering feedstock, process technology, plant capacity, application, and regional segments
Study Period 2021–2035
CAGR 4.95% (2026–2035)
Base Year Market Size USD 68.5 Billion (2025)
Forecast End-Point Market Size USD 111.1 Billion (2035)
Fastest Growing Segment Vehicle Fuel / RNG (by application); Dry Anaerobic Digestion (by technology)
Companies Profiled 10 major players, including EnviTec Biogas, Weltec Biopower, PlanET Biogas, Hitachi Zosen Inova, Air Liquide, and others
Valuation Currency USD (United States Dollar)


FAQs

What financing structures dominate the Biogas Market project development?

Tax-equity flip partnerships and project-finance debt at 70–80% leverage are the most common structures. Developers increasingly layer carbon-credit purchase agreements as collateral to improve debt-service coverage ratios [8].

How do biogas plants manage hydrogen sulfide corrosion in upgrading equipment?

Iron-oxide desulfurization beds and activated-carbon filters remove H₂S before gas enters upgrading membranes. Preventive replacement cycles every 6–12 months keep corrosion-related downtime below 2% annually [13].

What role do tipping fees play in the Biogas Market project economics?

Tipping fees of USD 40–80 per tonne for organic waste represent 15–25% of a typical plant's annual revenue. They effectively subsidize gas production by monetizing the waste-reception function [9].

How are biogas operators adapting to feed-in tariff expirations in Germany?

Post-tariff plants are shifting to direct marketing of upgraded biomethane on spot exchanges and securing bilateral corporate offtake agreements. Flexible CHP dispatch premiums partially offset lost feed-in revenue [3].

What biosecurity protocols apply to Biogas Market facilities processing animal by-products?

EU Regulation 1069/2009 requires pasteurization at 70°C for one hour before the digestion of Category 3 animal by-products. Compliance adds EUR 50,000–100,000 in annual processing costs per facility [17].

How does altitude affect anaerobic digester performance?

Atmospheric pressure drops at elevations above 2,000 meters reduce gas-transfer efficiency by 5–8%. High-altitude installations in the Andes and Himalayas compensate with insulated reactor designs and extended retention times [12].

What warranty terms are standard for Biogas Market digester equipment?

Major EPC providers typically offer 2-year full warranties and 10-year structural guarantees on steel tanks. Extended performance warranties covering minimum methane-yield thresholds are emerging as a competitive differentiator [6].    
Author
Author
Author Profile
Chitranshi Jaiswal LinkedIn
Team Lead - Research
Chitranshi is a Team Leader in the Chemicals & Materials (CnM) and Energy & Power (EnP) domains, with 6+ years of experience in market research. She leads and mentors teams to deliver cross-domain projects that equip clients with actionable insights and growth strategies. She is skilled in market estimation, forecasting, competitive benchmarking, and both primary & secondary research, enabling her to turn complex data into decision-ready insights. An engineer and MBA professional, she combines technical expertise with strategic acumen to solve dynamic market challenges. Chitranshi has successfully managed projects that support market entry, investment planning, and competitive positioning, while building strong client relationships. Certified in Advanced Excel & Power BI she leverages data-driven approaches to ensure accuracy, clarity, and impactful outcomes.

Research Approach


Secondary Research

The secondary research process involved comprehensive analysis of regulatory databases, peer-reviewed energy journals, industry publications, and authoritative environmental and energy organizations. Key sources included the International Energy Agency (IEA) Bioenergy Programme, International Renewable Energy Agency (IRENA), European Biogas Association (EBA), American Biogas Council (ABC), German Biogas Association (Fachverband Biogas e.V.), US Environmental Protection Agency (EPA) Landfill Methane Outreach Program (LMOP), US Department of Energy (DOE) Office of Energy Efficiency & Renewable Energy, European Environment Agency (EEA), Eurostat Energy Database, Food and Agriculture Organization (FAO) of the United Nations, World Bioenergy Association (WBA), National Renewable Energy Laboratory (NREL), IEA Bioenergy Task 37 (Energy from Biogas), Global Methane Initiative (GMI), United Nations Framework Convention on Climate Change (UNFCCC) CDM Database, European Commission Directorate-General for Energy, US Energy Information Administration (EIA), German Energy Agency (dena), BiogasWorld Industry Database, and national energy ministry reports from key markets including Germany, France, UK, China, India, USA, and Brazil. These sources were used to collect biogas production capacity data, regulatory policy frameworks, feedstock availability statistics, anaerobic digestion plant operational data, biomethane injection statistics, carbon credit pricing trends, and renewable energy incentive programs across agricultural waste, municipal solid waste, industrial waste, and sewage sludge segments.


Primary Research

Qualitative and quantitative insights were obtained by interviewing supply-side and demand-side stakeholders during the primary research process. The supply-side sources consisted of CEOs, Chief Technology Officers, VPs of Engineering, regulatory affairs managers, and business development directors from biogas plant operators, anaerobic digestion technology providers, biogas upgrading equipment manufacturers, and agricultural waste management companies. Sustainability directors from food processing companies, waste management facility operators, municipal utility managers, agricultural cooperative leaders, and procurement heads from energy-intensive industrial facilities such as cement, steel, and chemical plants constituted demand-side sources. Primary research has confirmed the project pipeline timelines for anaerobic digestion and landfill gas recovery facilities, validated market segmentation across electricity generation, transportation fuel, heat generation, and biomethane production applications, and gathered insights on feedstock procurement strategies, energy grid injection tariffs, carbon credit monetization dynamics, and biogas upgrading technology adoption.

Primary Respondent Breakdown:

By Designation: C-level Primaries (28%), Director Level (42%), Others (30%)

By Region: North America (30%), Europe (32%), Asia-Pacific (28%), Rest of World (10%)


Market Size Estimation

Global market valuation was derived through installed capacity mapping and biogas production volume analysis. The methodology included:

Identification of 60+ key biogas plant operators and technology providers across North America, Europe, Asia-Pacific, and Latin America

Plant mapping across anaerobic digestion, landfill gas recovery, gasification, and pyrolysis technology categories

Analysis of reported and modeled annual revenues specific to biogas plant operations, equipment sales, and biomethane production portfolios

Coverage of operators and technology providers representing 75-80% of global installed biogas

Download Free Sample

Kindly complete the form below to receive a free sample of this Report

Download PDF ×

We do not share your information with anyone. However, we may send you emails based on your report interest from time to time. You may contact us at any time to opt-out.