Structural Health Monitoring Market

Key Players: HBK (Hottinger Brüel & Kjær), National Instruments (NI), Campbell Scientific, Sixense (Vinci Group), OSMOS Group, Structural Monitoring Systems (SMS), Advitam Inc., Geocomp Corp.

Structural Health Monitoring Market

Structural Health Monitoring Market Size, Share and Research Report By Component (Hardware, Software, Services), By Technology (Wired, Wireless), By Installation Type (Retrofit, New Construction), By Monitoring Frequency (Continuous Monitoring, Periodic Monitoring), By End-Use Industry (Civil Infrastructure, Energy & Power, Dams & Waterways, Aerospace & Defense, Mining & Industrial, Others) and By Region (North America, Europe, South America, Asia Pacific, Middle East and Africa) - Industry Forecast to 2035.
ID: MRFR/ICT/9371-HCR
100 Pages
Nirmit Biswas
Last Updated: June 22, 2026

Structural Health Monitoring Market Summary

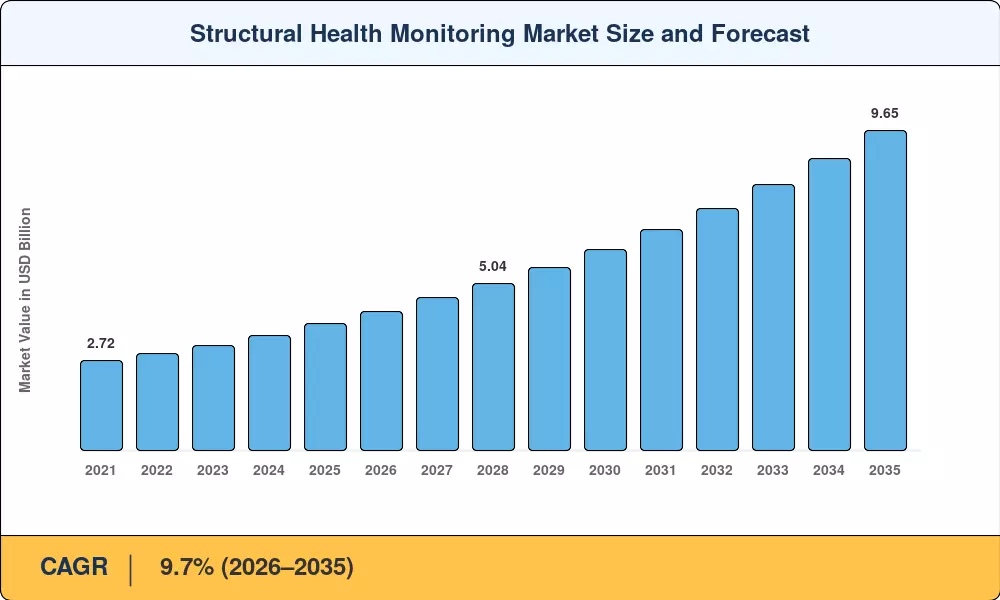
The Structural Health Monitoring Market reached USD 3.82 Billion in 2025, driven by mounting pressure on governments and asset owners to shift from scheduled inspections to continuous, data-driven surveillance of critical structures. Starting from an estimated USD 4.19 Billion in 2026, the Structural Health Monitoring Market is projected to climb to USD 9.65 Billion by 2035, registering a 9.7% CAGR over the forecast window. The U.S. Bipartisan Infrastructure Law's USD 550 Billion allocation and the EU's revised Construction Products Regulation have anchored demand for structural integrity sensors and bridge sensor monitoring solutions across aging road and rail networks [2][3].

A decisive technology transformation is reshaping spending patterns within the Structural Health Monitoring Market. Legacy manual-inspection regimes — visual walk-throughs, periodic load testing, and paper-based condition reports — are giving way to permanently installed vibration analysis systems, fiber-optic strain gauges, and cloud-hosted civil infrastructure analytics platforms. The World Bank estimates that every USD 1 invested in predictive building health diagnostics saves USD 4 in deferred-maintenance costs for public infrastructure assets [4]. IoT densification and edge-compute hardware have cut per-sensor deployment costs by roughly 38% since 2020, lowering adoption barriers for mid-tier asset operators.

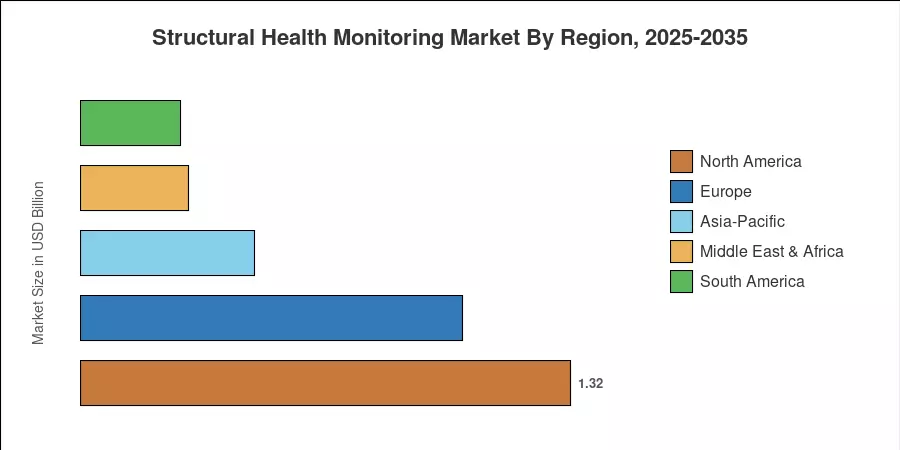
North America commands the largest share of the Structural Health Monitoring Market at approximately 34.5% of 2024 revenue, underpinned by federal bridge-inspection mandates and pipeline-integrity rules. Asia-Pacific is the fastest-growing region, expanding at a 12.2% CAGR as megaproject pipelines in China, India, and ASEAN nations embed bridge sensor monitoring from the design phase. Europe holds the second-largest share at roughly 27%, propelled by Eurocode seismic-retrofit directives and cross-border rail safety standards. The next decade will see sensor-edge-cloud architectures become the default specification for all newly financed public structures.


Key Report Takeaways

• By Component

  • Hardware dominated the Structural Health Monitoring Market in 2024, capturing approximately 65% of global revenue, reflecting high upfront costs for accelerometers, strain gauges, and data-acquisition units.
  • Software is the fastest-growing component segment, advancing at an 11.2% CAGR through 2035 as building health diagnostics platforms shift to SaaS subscription models.

• By Technology

  • Wired systems accounted for roughly 72% of the Structural Health Monitoring Market in 2024, favored for long-span bridges and dams where power availability is reliable.
  • Wireless solutions are projected to register a 12.1% CAGR, driven by civil infrastructure analytics use cases in remote or retrofit-constrained environments.

• By End-Use Industry

  • Civil infrastructure captured the largest end-use share in 2024 at approximately 60%, reflecting heavy public investment in bridge sensor monitoring and tunnel surveillance.
  • Energy and power applications are expected to grow at a 10.6% CAGR as wind-turbine operators and nuclear facilities expand vibration analysis systems for asset-life extension.

• By Region

  • North America led the Structural Health Monitoring Market with an estimated 34.5% revenue share in 2024.
  • Asia-Pacific is forecast to expand at a 12.2% CAGR, the fastest of any region, fueled by smart-city mandates and USD 43 Trillion in projected infrastructure spending through 2050 [1].


Market Size and Forecast (2021–2035)

Market sizing draws on bottom-up revenue analysis of sensor and software vendors, triangulated against top-down macro indicators (infrastructure capex, bridge-inventory data, and regulatory-compliance budgets). All figures are expressed in USD Billion at constant 2025 exchange rates.

Structural Health Monitoring Market Size and Forecast
Our Impact
Enabled $4.3B Revenue Impact for Fortune 500 and Leading Multinationals
Partnering with 2000+ Global Organizations Each Year
30K+ Citations by Top-Tier Firms in the Industry

Driver Impact Analysis

Driver ~% Impact on CAGR Geographic Relevance Impact Timeline
Aging infrastructure mandates ~22% North America, Europe Short-term (≤2 yr)
IoT sensor cost reduction ~18% Global Medium-term (2–4 yr)
Smart-city & digital-twin programs ~16% Asia-Pacific, Europe Medium-term (2–4 yr)
Insurance premium incentives ~12% North America, Europe Short-term (≤2 yr)
Climate-resilience retrofits ~14% Global Long-term (≥4 yr)
AI-driven predictive analytics ~10% Global Long-term (≥4 yr)
Energy-sector asset-life extension ~8% Middle East, Asia-Pacific Medium-term (2–4 yr)


Aging Infrastructure Mandates

The U.S. Federal Highway Administration flagged over 42,000 bridges as structurally deficient in its 2023 National Bridge Inventory, directing USD 40 Billion in dedicated repair funding under the Bipartisan Infrastructure Law [2]. This mandate effectively requires continuous bridge sensor monitoring for every federally funded rehabilitation project, converting a discretionary technology into a compliance necessity. European rail operators face analogous pressure under the revised EN 1990 Eurocode, which now references permanent vibration analysis systems as a preferred verification method for high-speed corridors.

IoT Sensor Cost Reduction

MEMS accelerometer unit costs fell from approximately USD 18 in 2018 to under USD 11 by 2025, a trajectory that the World Economic Forum attributes to smartphone-scale manufacturing and 5G backhaul availability [4][6]. Lower price points make dense structural integrity sensor deployments viable for secondary assets — parking structures, pedestrian bridges, and industrial silos — that were previously uneconomical to instrument. This broadening of the addressable base adds volume growth independent of marquee mega-projects.

Smart-City and Digital-Twin Programs

Singapore's National Digital Twin initiative and China's "CIM Platform" directive both mandate real-time civil infrastructure analytics feeds from all new public buildings over 10,000 m² [7]. Digital twins consume time-series data from embedded sensors to simulate load scenarios, detect micro-crack propagation, and schedule maintenance windows. These programs turn building health diagnostics from a standalone discipline into a data layer within urban operating systems, anchoring recurring software revenue for vendors.

Climate-Resilience Retrofits

The IPCC's AR6 report estimates that climate-driven extreme weather will increase structural load cycles by 15–25% in coastal and flood-prone zones by 2040 [11]. Governments in the Gulf Cooperation Council, Southeast Asia, and the Caribbean are now specifying permanent vibration analysis systems for seawall, levee, and offshore-platform monitoring as part of national adaptation plans. These long-horizon programs sustain demand well beyond the current capex cycle.


Restraints Impact Analysis

Restraint ~% Drag on CAGR Geographic Relevance Impact Timeline
High upfront deployment costs ~–20% Emerging markets Short-term (≤2 yr)
Data interoperability fragmentation ~–18% Global Medium-term (2–4 yr)
Skilled-workforce shortage ~–15% Asia-Pacific, MEA Long-term (≥4 yr)
Cybersecurity risks for sensor networks ~–12% North America, Europe Medium-term (2–4 yr)
Regulatory inconsistency across jurisdictions ~–10% Global Long-term (≥4 yr)


High Upfront Deployment Costs

A full-coverage structural integrity sensor installation on a 500-meter cable-stayed bridge can cost USD 1.2–2.5 Million, excluding ongoing data management [13]. Municipal agencies in Latin America and Sub-Saharan Africa frequently lack the capital or financing mechanisms to absorb these costs, constraining the Structural Health Monitoring Market's penetration in lower-income geographies. Leasing and sensor-as-a-service models are emerging but remain nascent.

Data Interoperability Fragmentation

No universally adopted data schema exists for structural health monitoring data exchange. Vendors use proprietary file formats, complicating multi-vendor deployments and limiting the portability of civil infrastructure analytics across asset portfolios [14]. Efforts such as the Open Geospatial Consortium's SensorThings API are gaining traction, yet full harmonization is likely five or more years away.

Skilled-Workforce Shortage

Interpreting high-frequency sensor output requires expertise at the intersection of structural engineering, signal processing, and data science — a profile that universities are only beginning to formalize. The American Society of Civil Engineers estimates that fewer than 8,000 professionals globally hold dual competency in structural dynamics and machine-learning-based building health diagnostics [15].


Structural Health Monitoring Market Opportunities

Sensor-as-a-Service Business Models

Asset operators are increasingly looking for opex-based pricing rather than big capex outlays. Vendors who bundle structural integrity sensors hardware with cloud-hosted analytics subscriptions can help reduce adoption hurdles in price-sensitive markets such as municipal water utilities and mid-rise commercial structures. OSMOS, Advitam and other early movers are already north of 30% recurring income.


Emerging-Market Infrastructure Buildout

The USD 43 Trillion infrastructure gap in Asia-Pacific through 2050 and Africa's yearly USD 130 Billion deficit [1][18] generate Greenfield demand for embedded bridge sensor monitoring from day one of construction. Civil infrastructure analytics are increasingly being made a pre-requisite, not an add-on, by multilateral development banks, who are conditioning concessional loans on lifecycle monitoring obligations.


AI-Powered Predictive Maintenance Platforms

Machine-learning systems trained on millions of sensor hours can predict sub-millimeter displacement patterns months before they become apparent manifestations. The combination of edge AI chipsets and 5G connection will create new software income opportunities for suppliers by allowing real-time vibration analysis systems to automatically generate maintenance work orders.


Data Monetization and Insurance Integration

Insurers are starting to provide an 8–15% rate reduction for structures with continuous building health diagnostics [10]. The sensor data also has resale value to catastrophe-modeling organizations, urban planners and climate-risk analysts, establishing a secondary data-monetization layer on top of the initial monitoring contract.


Offshore Energy and Wind-Turbine Monitoring

Offshore wind capacity is projected to exceed 380 GW globally by 2035 [12]. Each turbine foundation requires continuous load and fatigue monitoring, driving demand for marinized structural integrity sensors and corrosion-tracking systems. This vertical alone could represent USD 800 Million in incremental Structural Health Monitoring Market revenue by 2035.


Structural Health Monitoring Market Future Outlook

AI-Autonomous Inspection Systems

By 2030, the convergence of edge-AI inference chips and drone-mounted LiDAR will enable fully autonomous structural inspections that supplement fixed sensor networks. The U.S. DOE projects that AI-driven anomaly detection can reduce false-positive maintenance alerts by 60%, cutting operational costs for bridge sensor monitoring programs and accelerating adoption in cost-sensitive jurisdictions [9].

Platform Economics and Vendor Consolidation

Asset owners are migrating from point-solution sensors toward integrated civil infrastructure analytics ecosystems that unify data ingestion, alerting, and reporting. This platform shift rewards vendors with broad hardware-software portfolios, accelerating M&A consolidation. MRFR expects the top-five vendor share to rise from roughly 35% today to over 45% by 2032 as smaller sensor-only firms are absorbed.

Sustainability and ESG Reporting Requirements

The EU Corporate Sustainability Reporting Directive (CSRD) and SEC climate-disclosure proposals will require asset-intensive companies to quantify physical-climate risk at the facility level [11]. Continuous building health diagnostics data feeds directly into ESG-grade risk models, converting the Structural Health Monitoring Market from a safety investment into a compliance necessity for listed infrastructure operators.

Electrification and Energy-Transition Infrastructure

The IEA estimates USD 4.5 Trillion in annual clean-energy investment will be needed by 2030 [12]. Offshore wind monopiles, battery-storage enclosures, and high-voltage transmission towers all require permanent vibration analysis systems and fatigue monitoring, creating a structural-monitoring layer beneath the broader electrification supercycle.


Structural Health Monitoring Market Segmentation

By Component (Hardware, Software, Services)

Segment Metric Primary Demand Driver
Hardware ~65% share (2024) Accelerometers, DAQ units, fiber-optic sensors
Software 11.2% CAGR (2026–2035) SaaS analytics, digital-twin platforms
Services USD 0.58 Billion (2025) Installation, calibration, managed monitoring


Hardware remains the revenue backbone of the Structural Health Monitoring Market because every deployment starts with physical structural integrity sensors — accelerometers, tiltmeters, strain gauges, and corrosion probes. Sensor arrays for a single long-span bridge can include 200–400 individual channels, each requiring ruggedized enclosures, cabling, and junction hardware. Software, however, is the margin story: cloud-hosted civil infrastructure analytics platforms command 70–85% gross margins versus 35–45% for hardware, incentivizing vendors to bundle analytics to capture recurring revenue.

By Technology (Wired, Wireless)

Segment Metric Primary Demand Driver
Wired ~72% share (2024) High-reliability, continuous power, long-span bridges
Wireless 12.1% CAGR (2026–2035) Retrofit flexibility, remote locations, cost efficiency


Wired bridge sensor monitoring systems dominate existing installations because they deliver uninterrupted power and data throughput essential for continuous monitoring on critical spans. Wireless alternatives are gaining share rapidly in the Structural Health Monitoring Market as LPWAN protocols (LoRaWAN, NB-IoT) extend battery life to five-plus years while reducing installation costs by up to 40% — a decisive advantage for building health diagnostics retrofits in occupied structures.

By Installation Type (Retrofit, New Construction)

Segment Metric Primary Demand Driver
Retrofit ~62% share (2024) Aging infrastructure compliance mandates
New Construction 13.0% CAGR (2026–2035) Born-instrumented design specifications


Retrofit projects still account for the majority of the Structural Health Monitoring Market because the global stock of uninstrumented bridges, dams, and high-rises vastly outnumbers new builds. New construction, however, is growing faster as codes in Singapore, China, and the EU mandate embedded vibration analysis systems at the design phase, ensuring that every major structure enters service with baseline sensor coverage.

By End-Use Industry

Segment Metric Primary Demand Driver
Civil Infrastructure ~60% share (2024) Bridge, tunnel, and highway monitoring mandates
Energy & Power 10.6% CAGR (2026–2035) Wind, nuclear, and pipeline integrity programs
Dams & Waterways USD 0.31 Billion (2025) Dam-safety legislation, flood-risk management


Civil infrastructure remains the anchor vertical for the Structural Health Monitoring Market, driven by mandatory bridge sensor monitoring programs in the U.S., EU, and Japan. Energy and power are the fastest-expanding end use as wind-farm operators and nuclear utilities deploy structural integrity sensors to extend asset life beyond original design horizons, reducing the levelized cost of energy.


Regional Market Share Analysis

Region Metric Primary Investment Themes
North America ~34.5% share (2024) Federal bridge mandates, pipeline integrity, smart-city pilots
Europe ~27.0% share (2024) Eurocode retrofits, rail safety, offshore wind
Asia-Pacific 12.2% CAGR (2026–2035) Megaprojects, CIM digital twins, smart cities
South America USD 0.27 Billion (2025) Hydropower dam monitoring, urban transit
Middle East & Africa USD 0.29 Billion (2025) Oil & gas asset integrity, mega-city construction
Total USD 3.82 Billion (2025)

The Structural Health Monitoring Market exhibits meaningful regional variation. North America leads on installed base and regulatory maturity, while Asia-Pacific is the clear growth engine. Europe occupies a strong second position, and emerging regions are beginning to build foundational demand through multilateral-funded projects that specify bridge sensor monitoring and vibration analysis systems.


North America

Country Metric Key Driver
US ~76% of regional share FHWA bridge mandates, DOT sensor funding [2]
Canada 8.4% CAGR Climate-resilience retrofits for northern infrastructure [11]
Mexico USD 0.06 Billion (2025) PPP-financed toll-road monitoring [19]


The U.S. dominates North American spending on the Structural Health Monitoring Market, with the Infrastructure Investment and Jobs Act directing over USD 12 Billion specifically toward bridge rehabilitation projects requiring continuous civil infrastructure analytics. Canada's Investing in Canada Infrastructure Program allocates CAD 33 Billion for green and resilient public assets, increasingly specifying embedded structural integrity sensors for bridges in permafrost zones.

Europe

Country Metric Key Driver
Germany ~22% of regional share Autobahn bridge program, Industry 4.0 [3]
UK 9.1% CAGR HS2 rail monitoring, post-RAAC building inspections [20]
France USD 0.18 Billion (2025) Nuclear facility life-extension sensing [12]
Italy ~12% of regional share Post-Genoa seismic retrofit mandates [21]
Spain 8.8% CAGR High-speed rail expansion monitoring
Nordic Countries USD 0.11 Billion (2025) Offshore wind and Arctic bridge resilience
Russia ~5% of regional share Pipeline and railway corridor monitoring
Rest of Europe 8.5% CAGR EU Cohesion Fund infrastructure upgrades


Europe's Structural Health Monitoring Market benefits from stringent post-disaster regulations. Italy's post-Morandi bridge legislative package mandates permanent vibration analysis systems on all highway viaducts over 50 meters, while the UK's RAAC-concrete crisis has driven urgent building health diagnostics retrofits across the public estate [20][21].

Asia-Pacific

Country Metric Key Driver
China ~38% of regional share CIM Platform mandate, high-speed rail network [7]
India 13.5% CAGR National Infrastructure Pipeline USD 1.4 Trillion plan [22]
Japan USD 0.19 Billion (2025) Seismic early-warning integration [23]
South Korea 11.8% CAGR Smart-city K-City testbed, bridge sensor monitoring adoption
ASEAN ~14% of regional share ADB-financed transport corridors [1]
Rest of Asia-Pacific 10.4% CAGR Australia road-network digital twins


Asia-Pacific's rapid expansion within the Structural Health Monitoring Market reflects both scale and policy ambition. India's National Infrastructure Pipeline earmarks USD 1.4 Trillion across transport, energy, and urban sectors through 2030, with structural integrity sensors mandated for all nationally important bridges under NHAI guidelines [22].

South America

Country Metric Key Driver
Brazil ~52% of regional share Hydropower dam-safety regulations [24]
Argentina 8.3% CAGR Urban transit bridge retrofits
Rest of South America USD 0.05 Billion (2025) Mining-infrastructure monitoring


Brazil's 2020 Dam Safety Law (Lei 14.066) requires continuous civil infrastructure analytics on all high-risk tailings and hydroelectric dams, providing a regulatory floor for the Structural Health Monitoring Market across the region [24].

Middle East & Africa

Country Metric Key Driver
Saudi Arabia ~30% of regional share NEOM and Vision 2030 megaprojects [25]
UAE 9.6% CAGR Smart-building codes in Dubai and Abu Dhabi
South Africa USD 0.04 Billion (2025) Mining headgear and transport corridor sensing
Egypt 8.9% CAGR New Administrative Capital infrastructure [26]
Rest of MEA ~18% of regional share Oil & gas pipeline integrity programs


Saudi Arabia's NEOM project and broader Vision 2030 program embed vibration analysis systems and building health diagnostics into every public structure from the design stage, making the Kingdom the regional anchor for the Structural Health Monitoring Market [25].


Structural Health Monitoring Market By Region, 2025-2035

Competitive Benchmarking

The Structural Health Monitoring Market exhibits medium concentration, with the top five vendors holding an estimated 33–38% of global revenue. The competitive structure blends specialized sensor manufacturers, large industrial-test conglomerates, and emerging software-first analytics firms. Fragmentation persists in regional installation and services segments, where local engineering consultancies capture project-level contracts. M&A activity is intensifying as hardware incumbents acquire software capabilities to offer end-to-end civil infrastructure analytics platforms.

Company Est. Revenue Share Range Key Offerings Strategic Positioning
HBK (Hottinger Brüel & Kjær) ~7–10% Strain gauges, DAQ systems, vibration analysis systems Full-stack sensing and analytics
National Instruments (NI) ~5–8% Modular DAQ, LabVIEW-based analytics Platform-centric, multi-industry
Campbell Scientific ~4–7% Rugged data loggers, environmental sensors Niche: remote and harsh environments
Sixense (Vinci Group) ~4–6% Monitoring services, building health diagnostics Vertically integrated, construction-linked
OSMOS Group ~3–5% Fiber-optic sensors, SaaS monitoring Subscription-first model
Structural Monitoring Systems (SMS) ~2–4% Comparative vacuum monitoring patches Aerospace crossover technology
Advitam Inc. ~2–4% Cloud platform, bridge sensor monitoring Software-first, U.S. federal contracts
Geocomp Corp. ~2–3% Geotechnical + structural monitoring Consulting-plus-technology hybrid
Acellent Technologies ~1–3% SMART Layer® embedded sensors OEM partnerships, aerospace / defense
Digitexx Data Systems ~1–2% Seismic + structural recorders Earthquake-prone regions focus


Recent News & Developments


  • Campbell Scientific and the Royal Netherlands Meteorological Institute (KNMI) worked together in June 2023 to improve the surface observation system in the Netherlands. “The purpose of this partnership is to improve accuracy and reliability of weather data collection through deployment of advanced sensors and data acquisition systems provided by Campbell Scientific.


Structural Health Monitoring Market Report Scope

Parameter Detail
Market Scope Global Structural Health Monitoring Market across hardware, software, and services
Study Period 2021–2035
CAGR 9.7% (2026–2035)
Market Size (2025) USD 3.82 Billion
Market Size (2035) USD 9.65 Billion
Fastest Growing Segments Software (by component); Wireless (by technology); New Construction (by installation)
Companies Profiled 10 (HBK, NI, Campbell Scientific, Sixense, OSMOS, SMS, Advitam, Geocomp, Acellent, Digitexx)
Valuation Currency USD Billion


FAQs

What is the typical payback period for a structural health monitoring installation on a highway bridge?

Most highway bridge deployments achieve payback within 3–5 years through avoided emergency repairs and optimized maintenance scheduling. Agencies using continuous civil infrastructure analytics report 20–30% reductions in lifecycle maintenance costs [4].

How do asset owners compare fiber-optic versus MEMS-based structural integrity sensors for long-span bridges?

Fiber-optic sensors excel in distributed strain measurement over spans exceeding 500 meters, while MEMS accelerometers offer lower per-channel cost for dense vibration analysis systems. Selection hinges on span length, budget, and required measurement resolution [6].

What cybersecurity standards apply to IoT-enabled bridge sensor monitoring networks?

NIST SP 800-183 and IEC 62443 provide the primary frameworks for securing sensor-to-cloud data pipelines in the Structural Health Monitoring Market. Compliance typically requires encrypted telemetry, device authentication, and segmented network architectures [16].

Can structural health monitoring data satisfy regulatory inspection requirements in lieu of manual surveys?

Several jurisdictions — including Singapore and select U.S. states — now accept continuous sensor data as equivalent to biennial visual inspections for qualifying structures. Regulatory acceptance is expanding but remains jurisdiction-specific [7][2].

What role does 5G connectivity play in advancing the Structural Health Monitoring Market?

5G's low-latency, high-bandwidth characteristics enable real-time streaming of dense sensor arrays without edge-side data compression. This improves anomaly-detection speed for building health diagnostics on complex structures by 40–60% versus LTE backhaul [9].

How are insurance companies integrating structural monitoring data into underwriting?

Leading reinsurers now offer 8–15% premium reductions for structures equipped with continuous vibration analysis systems and verified data feeds. Sensor-derived risk scores are gradually replacing actuarial proxies in commercial property underwriting [10].

What procurement model — capex purchase or managed-service subscription — dominates the Structural Health Monitoring Market today?

Capex purchase still accounts for roughly 70% of deployments, but managed-service subscriptions are growing at twice the market rate. Public agencies favor subscriptions because they shift lifecycle risk to vendors and align costs with annual budgets [13].    
Author
Author
Author Profile
Nirmit Biswas LinkedIn
Senior Research Analyst
With 5+ years of expertise in Market Intelligence and Strategic Research, Nirmit Biswas specializes in ICT, Semiconductors, and BFSI. Backed by an MBA in Financial Services and a Computer Science foundation, Nirmit blends technical depth with business acumen. He has successfully led 100+ projects for global enterprises and startups, including Amazon, Cisco, L&T and Huawei, delivering market estimations, competitive benchmarking, and GTM strategies. His focus lies in transforming complex data into clear, actionable insights that drive growth, innovation, and investment decisions. Recognized for bridging engineering innovation with executive strategy, Nirmit helps businesses navigate dynamic markets with confidence.

Research Approach


Secondary Research

The secondary research process involved comprehensive analysis of technical standards databases, peer-reviewed engineering journals, civil infrastructure publications, and authoritative governmental transportation and infrastructure organizations. Key sources included the US Federal Highway Administration (FHWA), U.S. Department of Transportation (USDOT) Bureau of Transportation Statistics, European Committee for Standardization (CEN), ASTM International, ISO (International Organization for Standardization) Technical Committee 71 (Civil Engineering) and TC 108 (Mechanical Vibration and Shock), American Society of Civil Engineers (ASCE), Institution of Civil Engineers (ICE), International Association for Bridge and Structural Engineering (IABSE), Transportation Research Board (TRB), National Institute of Standards and Technology (NIST), European Union Open Data Portal (infrastructure & transport), World Bank Infrastructure Data and Global Infrastructure Facility, OECD Infrastructure Statistics, National Bridge Inventory (NBI) databases, IEEE Xplore Digital Library (sensors and IoT applications), ASCE Library (Journal of Structural Engineering, Journal of Bridge Engineering), ScienceDirect (Structural Health Monitoring journal), and national transport ministry reports from key infrastructure markets (Japan MLIT, China Ministry of Transport, UK Department for Transport). These sources were used to collect infrastructure condition statistics, regulatory compliance mandates, structural failure case studies, sensor deployment trends, and market landscape analysis for wired monitoring systems, wireless sensor networks, data acquisition hardware, and predictive analytics software platforms.


Primary Research

In order to gather qualitative and quantitative information unique to infrastructure monitoring ecosystems, supply-side and demand-side stakeholders were interviewed during the primary research process. Chief executive officers, vice presidents of engineering, heads of regulatory compliance and standards, and commercial directors from companies that produce structural sensors, data acquisition systems, and SHM software were examples of supply-side sources. Demand-side sources included procurement heads from civil infrastructure authorities, department of transportation (DOT) divisions, EPC contractors, wind farm operators, mining conglomerates, chief structural engineers, infrastructure asset managers, bridge inspection leads, aerospace maintenance directors, and energy sector reliability engineers. Primary research confirmed product development pipelines for MEMS and IoT-enabled sensors, validated market segmentation across hardware (accelerometers, strain gauges, tiltmeters, fiber optic sensors), software (cloud-based monitoring platforms, digital twin interfaces), and service segments (installation, calibration, maintenance). It also collected information on the dynamics of standards compliance, procurement cycles for public infrastructure projects, and barriers to technology adoption (ASTM E2300, ISO 13364, EN 13381).

Primary Respondent Breakdown:

• By Designation: C-level Primaries (28%), Director Level (35%), Others (37%)

• By Region: North America (32%), Europe (30%), Asia-Pacific (28%), Rest of World (10%)


Market Size Estimation

Global market valuation was derived through revenue mapping and deployment volume analysis across critical infrastructure assets worldwide. The methodology included:

• Identification of 40+ key manufacturers and system integrators across North America, Europe, Asia-Pacific, and Latin America specializing in sensing solutions, data acquisition systems, and monitoring software

• Product mapping across hardware (vibration sensors, strain monitoring devices, corrosion sensors, GPS displacement monitors), software (real-time monitoring platforms, AI-driven predictive analytics), and service categories (system integration, structural assessment consulting)

• Technology segmentation analysis across wired SHM systems (coaxial cable-based, fiber optic) and wireless SHM networks (ZigBee, LoRaWAN, cellular IoT, Wi-Fi 6)

• End-use vertical analysis covering civil infrastructure (bridges, tunnels, dams, high-rise buildings), aerospace & defense (aircraft airframes, wind turbine blades, military assets), energy (offshore platforms, nuclear containment, renewable assets), and mining (shaft integrity, tailings dams)

• Analysis of reported and modeled annual revenues specific to SHM solution portfolios, including direct sensor sales and recurring software-as-a-service (SaaS) monitoring contracts

• Coverage of manufacturers representing 65-70% of global market share in 2024

• Extrapolation using bottom-up (number of monitored structures × sensor density × ASP by geography) and top-down (manufacturer revenue validation and infrastructure investment correlation) approaches to derive segment-specific valuations for wired versus wireless technologies and hardware versus software & services revenue splits

Download Free Sample

Kindly complete the form below to receive a free sample of this Report

Download PDF ×

We do not share your information with anyone. However, we may send you emails based on your report interest from time to time. You may contact us at any time to opt-out.