Cargo Inspection Market Summary
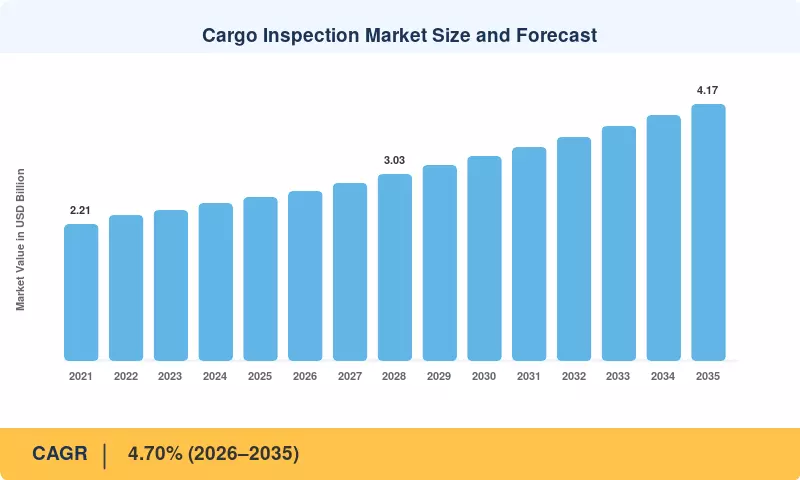
The Cargo Inspection Market was valued at USD 2.66 billion in 2025 and is forecast to rise from USD 2.76 billion in 2026 to USD 4.17 billion by 2035, expanding at a CAGR of 4.70% over 2026–2035. Two policy catalysts anchor this outlook. The IMO's global sulphur cap cut the permitted sulphur content of marine fuel from 3.50% to 0.50%, creating a permanent requirement for bunker sampling and fuel quality testing [1]. The EU Carbon Border Adjustment Mechanism enters its definitive phase in January 2026, pulling fertilisers, steel, and aluminium shipments into verified emissions reporting [7].
The industry is operationally shifting away from paper certificates, manual tank dips and lab reporting via courier. They are being replaced with mass flow meters, portable analyzers, remote-witnessed surveys and digitally signed certificates. Singapore’s mandated mass flow meter regime for bunkering set an early bar for measurement integrity [20]; carriers in the Digital Container Shipping Association have pledged to 100% adoption of the electronic bill of lading by 2030 [23]. That change makes the certificate itself a data product for suppliers in the Cargo Inspection Market, not a paper.
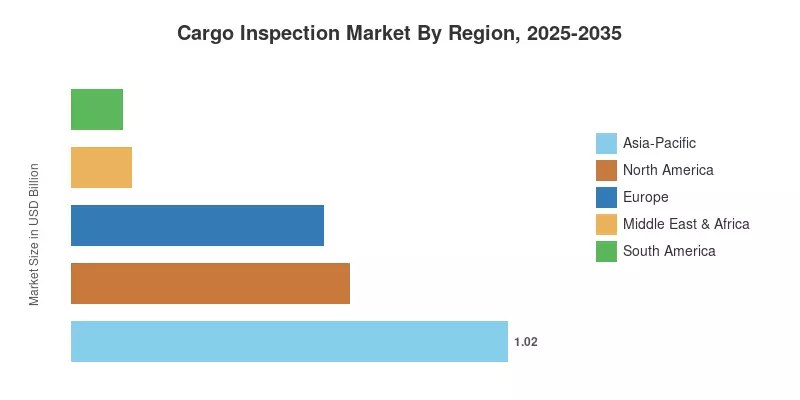
Asia-Pacific is the largest region at 38.4% and also the fastest-growing, driven by Chinese commodity imports, Indian port capacity additions and ASEAN mining exports. North America ranks #2 with USD 0.65 billion on the back of grain, crude and LNG exports dependent on third-party quantity and quality certification. Low-carbon fuels, essential minerals and traceability laws will have greater influence on demand-shaping than headline trade volume increases during the next decade.
Key Report Takeaways
• By Cargo Type
- Oil & Gas remained the largest cargo category in the Cargo Inspection Market, holding a 41.0% share in 2025 on the back of custody-transfer certification for crude and refined products.
- Chemicals & Fertilizers is the fastest-growing cargo category, projected to expand at a 7.80% CAGR as purity and lifecycle stewardship standards tighten.
- Metals & Minerals generated USD 0.49 billion in 2025, supported by copper, iron ore, and lithium concentrate trade.
• By Service Type
- Quality & Quantity Verification led service demand with a 32.4% share, reflecting its role in commercial settlement.
- Pre-shipment/Pre-loading Inspection is set to grow at a 7.12% CAGR as counterparties move scrutiny upstream.
- Weight & Draft Survey accounted for USD 0.50 billion, anchored in dry bulk and breakbulk trades.
• By Region
- Asia-Pacific led the Cargo Inspection Market with a 38.4% share and is also the fastest-growing region
- North America reached USD 0.65 billion, led by US agricultural and energy export certification
- Middle East & Africa is forecast to grow at a 5.3% CAGR, backed by bunkering hubs and mining corridors
Market Size and Forecast (2021–2035)
Market Research Future (MRFR) has estimated the size of the Cargo Inspection Market using a bottom-up approach, based on reported inspection revenues of major testing, inspection and certification providers. These estimates have been cross-checked against seaborne trade volumes by commodity from UNCTAD [2], commodity flow data from the IEA and USGS [10][12], and regulatory fee schedules including those published for US grain inspection [3]. Historical data were validated through primary interviews with surveyors, laboratory managers and commodity dealers, and forecasts use commodity-specific growth rates weighted by service mix.
Driver Impact Analysis
| Driver |
~% Impact on CAGR |
Geographic Relevance |
Impact Timeline |
Ref |
| Stricter marine fuel and emission rules |
+0.8% |
Global, strongest at bunkering hubs |
Medium-term (2–4 yr) |
[1][20] |
| Low-carbon fuel certification demand |
+0.7% |
Europe, North America |
Long-term (≥4 yr) |
[5][10] |
| Critical minerals trade expansion |
+0.6% |
Asia-Pacific, South America, Africa |
Long-term (≥4 yr) |
[11][12] |
| Digital customs filing and traceability mandates |
+0.6% |
Europe, with global spillover |
Short-term (≤2 yr) |
[6][7][8] |
| Standardized agricultural export grading |
+0.4% |
North America, South America |
Medium-term (2–4 yr) |
[3][14] |
| Chemicals and fertilizer product stewardship |
+0.5% |
Global |
Medium-term (2–4 yr) |
[4] |
| Trade finance linkage to early verification |
+0.5% |
Asia-Pacific, Middle East & Africa |
Short-term (≤2 yr) |
[9][13] |
Stricter Marine Fuel and Emission Rules
MARPOL Annex VI capped fuel sulphur at 0.50% globally and 0.10% inside Emission Control Areas, and the Mediterranean ECA added another high-traffic zone in May 2025 [1]. Every bunker delivery now carries compliance risk for the shipowner, which makes representative sampling, retained samples, and independent laboratory analysis a routine purchase rather than a dispute-only expense. Singapore's mass flow meter requirement reinforced quantity verification at the world's largest bunkering port [20].
Low-Carbon Fuel Certification Demand
ReFuelEU Aviation requires a 2% sustainable aviation fuel share at EU airports from 2025, rising to 6% by 2030 and 70% by 2050 [5]. Each blend step needs feedstock traceability, quality testing against aviation specifications, and chain-of-custody documentation. The IEA expects biofuel demand to keep rising through 2030 [10]. That trajectory translates directly into added laboratory capacity and new test methods for renewable diesel, marine biofuel blends, and hydrotreated feedstocks.
Critical Minerals Trade Expansion
The IEA estimates the market for key energy transition minerals at roughly USD 320 billion, with demand for lithium, nickel, cobalt, and copper set to climb sharply under announced climate pledges [11]. Concentrate shipments carry wide grade variation and high unit value, so buyers insist on independent sampling, moisture determination, and assay at both load and discharge ports. USGS data show import reliance for several critical minerals exceeding 50% in major consuming economies [12].
Digital Customs Filing and Traceability Mandates
The EU's Import Control System 2 requires carriers to file detailed entry summary data before loading, and its third release extended this to maritime cargo in June 2024 [6]. The EU Deforestation Regulation adds geolocation proof for seven commodities including soy, coffee, and palm oil [8], while CBAM requires embedded-emissions reporting [7]. Each rule pushes verification upstream and raises demand for documentation integrity checks alongside physical inspection.
Standardized Agricultural Export Grading
US grain exports move under Federal Grain Inspection Service standards with published hourly and per-unit fee schedules, which keeps official and third-party inspection embedded in every export lot [3]. FAO projects global cereal trade near record levels [14], and importing countries increasingly specify mycotoxin, moisture, and foreign-material limits in tenders. Standardized criteria stabilize service demand even when harvest volumes swing year to year.
Chemicals and Fertilizer Product Stewardship
The International Fertilizer Association's Protect & Sustain programme sets tiered certification covering production, storage, and distribution, with third-party audits benchmarking facilities against defined performance thresholds [4]. Ammonium nitrate handling rules tightened after the 2020 Beirut explosion, and CBAM's coverage of fertilisers adds emissions verification from 2026 [7]. Inspection scope now extends from purity testing to storage conditions and lifecycle documentation.
Trade Finance Linkage to Early Verification
Banks increasingly tie payment release under documentary credits to independent inspection certificates issued before loading. The WTO Agreement on Preshipment Inspection still frames government-mandated programs in several developing economies [9], and the World Bank notes that trade finance gaps are widest in lower-income markets [13]. Lenders seeking assurance on collateral quality are pushing early-stage verification into financing covenants, supporting pre-shipment service growth.
Restraints Impact Analysis
The negative impact percentages below indicate the directional drag each restraint places on growth in the Cargo Inspection Market. As with drivers, these estimates overlap and should not be summed against the headline CAGR.
| Restraint |
~% Impact on CAGR |
Geographic Relevance |
Impact Timeline |
Ref |
| Fee sensitivity and price competition |
−0.5% |
Global, acute in Asia-Pacific |
Short-term (≤2 yr) |
[15][17] |
| Shortage of qualified surveyors and chemists |
−0.4% |
North America, Europe |
Medium-term (2–4 yr) |
[18] |
| Trade route disruption and tariff volatility |
−0.5% |
Global |
Short-term (≤2 yr) |
[2] |
| Fragmented standards and accreditation regimes |
−0.3% |
Emerging markets |
Long-term (≥4 yr) |
[21][22] |
| Cannibalization from remote inspection |
−0.3% |
Global |
Medium-term (2–4 yr) |
[16] |
Fee Sensitivity and Price Competition
Routine quality and quantity certification for standard grades has become commoditized, and traders often award work through annual tenders with price as the deciding factor. Local independents undercut global networks by 15–30% on single-port jobs, compressing margins. Leading listed providers have responded with productivity programs and portfolio pruning, as reflected in their recent annual disclosures [15][17].
Shortage of Qualified Surveyors and Chemists
Marine surveying and petroleum laboratory work require years of supervised experience, and an ageing workforce is retiring faster than replacements qualify. Providers report persistent vacancies in laboratory and field roles, and ALS has highlighted labour availability as a constraint on capacity growth [18]. Staff shortages lengthen turnaround times at peak periods and push clients toward rival providers.
Trade Route Disruption and Tariff Volatility
UNCTAD reported that Suez Canal transits fell by roughly 42% in early 2024 as vessels diverted around the Cape of Good Hope [2]. Diversions shift inspection work between ports unpredictably, while sudden tariff changes can freeze contract flows for weeks. Providers carry fixed laboratory costs through these swings, which erodes utilization and pressures earnings.
Fragmented Standards and Accreditation Regimes
National standards for commodity grading, sampling, and certificate format differ widely, and not every inspection body holds ISO/IEC 17020 accreditation for the relevant scope [21]. The World Bank's Logistics Performance Index shows wide variation in customs and border quality across its 139 surveyed economies [22]. Fragmentation raises compliance costs for multinational providers entering new markets.
Cannibalization from Remote Inspection
Video-witnessed surveys, sensor-based tank monitoring, and automated draft reading reduce billable surveyor hours per job. Bureau Veritas and peers have expanded remote services to preserve client relationships [16], but each remote job typically generates lower revenue than a physical attendance. The transition trims top-line growth even as it improves provider margins.
Cargo Inspection Market Opportunities
The following opportunities highlight where providers in the Cargo Inspection Market can build revenue beyond core certification work.
Digital Certificates and Inspection Data Services
Electronic certificates, portal-based document management, and API delivery allow providers to sell inspection data as a subscription service. Aggregated quality and quantity records across thousands of shipments can support benchmarking, insurer risk scoring, and lender collateral monitoring. With carriers committed to fully electronic bills of lading by 2030 [23], inspection data that plugs into the same digital trade stack can command recurring fees.
Emerging Market Port and Mining Build-Outs
Africa's mining corridors, Indian port expansion, and ASEAN nickel processing are creating inspection demand in locations where accredited laboratory capacity remains thin. Providers that establish local laboratories early gain first-mover contracts with miners and state export agencies. Government pre-shipment programs in several African states offer multi-year concession revenue.
Sustainable Aviation Fuel and Biofuel Certification
The step from a 2% to a 6% SAF mandate in Europe by 2030 [5] requires feedstock audits, fuel testing, and sustainability certification at scale. Few laboratories currently hold full aviation fuel specification capability for synthetic blends. Early investment in these methods positions providers for premium-priced, specification-heavy work.
Carbon and Deforestation Compliance Bundles
CBAM and EUDR create new verification requirements covering embedded emissions and land-use provenance [7][8]. Providers can bundle physical inspection with emissions data verification and geolocation audits into a single compliance package. Exporters in Brazil, Indonesia, and West Africa need this support to keep EU market access.
Critical Minerals Provenance Verification
Battery makers and automakers face supply-chain due diligence rules requiring proof of origin and responsible sourcing for cobalt, lithium, and graphite [11]. Inspection firms already sampling concentrates at mine sites can extend into provenance certification and chain-of-custody auditing. This converts one-off assay work into continuous verification contracts.
Cargo Inspection Market Future Outlook
Four structural themes will shape the Cargo Inspection Market over the next decade, each shifting where value sits in the inspection workflow.
AI-Assisted Sampling and Damage Detection
Computer vision applied to hold imagery, drone-based stockpile surveys, and machine learning on laboratory data will shorten reporting cycles and flag anomalies before cargo moves. Providers are already piloting automated draft reading and image-based damage classification [15]. Physical sampling will remain essential for laboratory analysis, but AI will reduce the number of attendances needed per voyage and improve consistency between surveyors.
Platform Economics and Paperless Trade
The DCSA target of 100% electronic bills of lading by 2030 [23] and the EU's advance data rules [6] point to a trade system where documents flow as structured data. Inspection certificates will need to integrate with carrier, bank, and customs platforms, and customs inspection technology is moving toward risk scoring based on advance filings. Providers that own the data interface will capture more value than those issuing standalone PDFs.
Energy Transition Reshapes the Cargo Mix
The IEA projects global oil demand approaching a plateau before 2030 [10], while demand for critical minerals and low-carbon fuels continues to rise [11]. Oil & Gas will stay the largest cargo category through 2035, but its share will erode as minerals, biofuels, ammonia, and fertilizers gain weight. Inspection firms must retool laboratories for new specifications, including hydrogen carriers and synthetic fuels.
Carbon Disclosure Becomes an Inspection Deliverable
CBAM [7], the IMO Net-Zero Framework approved at MEPC 83 [19], and corporate Scope 3 reporting will make carbon intensity a routine attribute of traded cargo. Inspectors already present at load ports are positioned to verify fuel consumption, emissions factors, and product carbon footprints. By the early 2030s, carbon verification could become as standard as quantity certification on many bulk shipments.
Regional Market Share Analysis
| Region |
Key Metric (2025) |
Primary Investment Themes |
| North America |
USD 0.65 billion |
Grain export grading, crude and LNG custody transfer, SAF testing |
| Europe |
22.1% share |
CBAM and EUDR compliance, biofuel certification, ARA hub testing |
| Asia-Pacific |
38.4% share |
Iron ore and coal imports, critical minerals, bunkering; fastest-growing region |
| South America |
4.4% CAGR (2026–2035) |
Soy and grain exports, copper and lithium concentrates |
| Middle East & Africa |
5.3% CAGR (2026–2035) |
Bunkering hubs, mining corridors, pre-shipment programs |
| Total |
USD 2.66 billion |
— |
Regional demand in the Cargo Inspection Market follows commodity trade flows, bunkering activity, and the strength of national grading regimes. Asia-Pacific leads on import volume, while the Americas and the Middle East concentrate on export-side certification.
North America
| Country |
Key Metric (2025) |
Key Driver |
| US |
71.5% share of region |
FGIS grain grading, crude and LNG exports |
| Canada |
USD 0.10 billion |
Potash, canola, and critical minerals exports |
| Mexico |
5.1% CAGR (2026–2035) |
Nearshoring-driven industrial imports and fuel imports |
The US anchors regional demand through the world's largest grain export program and its rise as a leading LNG and crude exporter. FGIS fee schedules keep official inspection embedded in every export lot [3], while Gulf Coast refineries generate steady custody-transfer work. Canada's potash and canola trades rely on independent quality certification for Asian buyers, and Mexico's growing fuel imports support tank and vessel testing. Low-carbon fuel standards in California and Canada add biofuel certification to the Cargo Inspection Market in North America.
Europe
| Country |
Key Metric (2025) |
Key Driver |
| Germany |
19.8% share of region |
Chemicals trade and inland waterway cargo |
| UK |
USD 0.09 billion |
Energy imports and London-based commodity trading |
| France |
12.1% share of region |
Grain exports and refined product imports |
| Italy |
3.9% CAGR (2026–2035) |
Mediterranean ECA fuel compliance |
| Spain |
USD 0.05 billion |
Bunkering at Algeciras and agrifood trade |
| Nordic Countries |
8.4% share of region |
Biofuel production and metals exports |
| Russia |
2.6% CAGR (2026–2035) |
Grain and fertilizer exports under sanctions constraints |
| Rest of Europe |
17.2% share of region |
Netherlands and Belgium ARA hub testing |
Europe's inspection demand is being reshaped by regulation more than volume. CBAM's definitive phase from 2026 requires verified emissions data for fertiliser, steel, and aluminium imports [7], and EUDR adds provenance checks for agricultural commodities [8]. The Amsterdam–Rotterdam–Antwerp hub remains the region's largest testing cluster for refined products and biofuel blends. ReFuelEU obligations are prompting laboratory investment in aviation fuel specifications [5], while Russian trade volumes remain subdued under sanctions.
Asia-Pacific
| Country |
Key Metric (2025) |
Key Driver |
| China |
36.2% share of region |
Iron ore, coal, crude, and soybean imports |
| India |
6.9% CAGR (2026–2035) |
Port expansion and rising crude and coal imports |
| Japan |
USD 0.12 billion |
LNG and coal import verification |
| South Korea |
8.1% share of region |
Refining exports and LNG imports |
| ASEAN |
6.4% CAGR (2026–2035) |
Indonesian nickel, Singapore bunkering |
| Rest of Asia-Pacific |
USD 0.10 billion |
Australian iron ore and LNG exports |
Asia-Pacific holds the largest position in the Cargo Inspection Market because it combines the world's biggest commodity import base with major export hubs. China's customs authority shifted imported iron ore quality inspection from mandatory statutory checks to an on-application basis in 2020, which redirected work toward commercial third-party providers. India's port capacity additions and coal and crude imports support rapid growth, while Singapore's mass flow meter standard sets the regional benchmark for bunker quantity integrity [20]. Indonesian nickel processing drives concentrate assay work across ASEAN.
South America
| Country |
Key Metric (2025) |
Key Driver |
| Brazil |
54.6% share of region |
Soybean, iron ore, and crude exports |
| Argentina |
4.8% CAGR (2026–2035) |
Grain exports and Vaca Muerta crude |
| Rest of South America |
USD 0.04 billion |
Chilean and Peruvian copper, lithium concentrates |
Brazil dominates regional activity as the world's largest soybean exporter and a leading iron ore supplier, with Chinese buyers specifying detailed quality parameters. EUDR provenance rules add geolocation verification for Brazilian soy and beef heading to Europe [8]. Argentina's grain trade and growing crude exports support steady demand, while copper and lithium concentrate shipments from Chile and Peru require independent assay and moisture testing at load ports [12].
Middle East & Africa
| Country |
Key Metric (2025) |
Key Driver |
| Saudi Arabia |
24.3% share of region |
Crude, refined products, and petrochemical exports |
| UAE |
6.1% CAGR (2026–2035) |
Fujairah bunkering and re-export trade |
| South Africa |
USD 0.04 billion |
Coal, iron ore, and platinum group metals |
| Egypt |
10.5% share of region |
Suez Canal transit services and grain imports |
| Rest of MEA |
4.7% CAGR (2026–2035) |
West African mining and pre-shipment programs |
Saudi Arabia's crude and petrochemical exports generate large-scale quantity and quality work, while Fujairah ranks among the world's top bunkering hubs, supporting fuel testing growth in the UAE. South Africa's mineral exports require assay and sampling services, and Egypt remains one of the largest wheat importers. Government pre-shipment inspection programs in several African states continue under the framework of the WTO agreement [9], offering concession-based revenue.
Cargo Inspection Market Segmentation
By Cargo Type
| Segment |
Key Metric (2025) |
Primary Demand Driver |
| Oil & Gas |
41.0% share |
Custody transfer and marine fuel compliance |
| Metals & Minerals |
USD 0.49 billion |
Concentrate assay and critical minerals trade |
| Agriculture |
15.2% share |
Grain grading standards and importer specifications |
| Chemicals & Fertilizers |
7.80% CAGR (2026–2035) |
Purity rules, stewardship certification, CBAM |
| Consumer Goods |
USD 0.24 billion |
Electronic filing and pre-loading compliance |
| Others |
3.9% CAGR (2026–2035) |
Project cargo and specialized shipments |
Oil & Gas remains the foundation of the Cargo Inspection Market by cargo type, as crude, refined product, LNG, and bunker shipments all require independent quantity and quality certification. Chemicals & Fertilizers is growing fastest on tighter purity standards, IFA stewardship certification [4], and CBAM coverage. Metals & Minerals benefits from copper and battery-mineral assay demand, while Agriculture relies on standardized grading. Consumer Goods inspection is shifting toward documentation integrity, and Others covers project and specialized cargo.
By Service Type
| Segment |
Key Metric (2025) |
Primary Demand Driver |
| Quality & Quantity Verification |
32.4% share |
Commercial settlement between buyers and sellers |
| Weight & Draft Survey |
USD 0.50 billion |
Dry bulk and breakbulk volume confirmation |
| Damage & Contamination Inspection |
15.7% share |
Insurance claims and causality evidence |
| Pre-shipment/Pre-loading Inspection |
7.12% CAGR (2026–2035) |
Trade finance covenants and dispute prevention |
| Others |
USD 0.31 billion |
Bunker surveys, load and discharge supervision |
Quality & Quantity Verification leads the Cargo Inspection Market by service type because it underpins payment settlement for virtually every bulk trade. Pre-shipment/Pre-loading Inspection grows fastest as lenders tie payment release to early certification [9]. Weight & Draft Survey stays essential for bulk carriers, while Damage & Contamination Inspection gains from insurer demands for stronger evidence. The Others segment includes bunker quantity and fuel quality surveys plus load and discharge supervision.
Competitive Benchmarking
The Cargo Inspection Market is relatively concentrated with an estimated Herfindahl index of approximately 450-550. The top five providers combined hold an estimated 38-45% market share, with three diverse testing, inspection and certification businesses with global laboratory networks leading the pack. Specialist petroleum inspectors and regional independents compete on turnaround, local presence and price under them. Acquisitions remain the principal way for incumbents to enhance laboratory depth in growth areas.
| Company |
Est. Revenue Share Range |
Key Offerings for Cargo Inspection Market |
Strategic Positioning |
| SGS SA |
~11–14% |
Oil, gas, chemicals, minerals, and agricultural inspection and testing |
Broadest global network; leads in minerals and agricultural services |
| Bureau Veritas |
~9–12% |
Commodities inspection, marine fuel testing, remote survey services |
Strong petroleum and metals presence; digital certificate focus |
| Intertek Group plc |
~8–11% |
Caleb Brett petroleum inspection, minerals and agri testing |
Deep oil and chemicals laboratory footprint |
| ALS Limited |
~4–6% |
Geochemistry, metallurgy, and minerals assay |
Mining-cycle leader with acquisition-led expansion |
| Cotecna Inspection SA |
~3–5% |
Pre-shipment inspection, agricultural and government programs |
Strong in government concessions and emerging markets |
| AmSpec |
~2–4% |
Petroleum and chemicals inspection, laboratory testing |
Specialist in energy cargo across the Americas |
| Saybolt (Core Laboratories) |
~2–4% |
Crude and refined product inspection, fuel analysis |
Petroleum specialist with global terminal coverage |
| Camin Cargo Control |
~2–3% |
Petroleum, chemicals, and gas inspection |
Agile independent with growing international network |
| Alex Stewart International |
~1–3% |
Metals and minerals sampling, assay, and supervision |
Niche strength in concentrates and ores |
| Control Union |
~1–3% |
Agricultural inspection and sustainability certification |
Combines inspection with supply chain certification |
Recent News & Developments
The developments below illustrate how regulation and consolidation are reshaping the Cargo Inspection Market.
- European Commission (October 2023): CBAM transitional reporting began for fertilisers, iron and steel, aluminium, cement, electricity, and hydrogen imports, creating new demand for emissions data verification ahead of the 2026 definitive phase [7]
- European Commission DG TAXUD (June 2024): ICS2 Release 3 extended advance cargo data filing to maritime and inland carriers, pushing documentation checks upstream to origin ports [6]
- UNCTAD (October 2024): Review of Maritime Transport 2024 documented Red Sea and Panama Canal disruptions lengthening voyages, which shifted inspection workloads between ports [2]
- European Union (January 2025): The ReFuelEU Aviation 2% SAF minimum took effect at EU airports, expanding aviation fuel certification requirements [5]
- SGS and Bureau Veritas (January 2025): SGS confirmed preliminary merger discussions with Bureau Veritas before both parties ended talks, signalling appetite for scale in the sector [15][16]
- IMO (April 2025): MEPC 83 approved draft amendments establishing the IMO Net-Zero Framework, pointing toward fuel greenhouse gas intensity verification [19]
- IMO and Mediterranean coastal states (May 2025): The Mediterranean Sea ECA took effect with a 0.10% fuel sulphur limit, raising bunker testing demand across the region [1]




 Noah Malgeri
Co-Founder

 Peter Groot koerkamp
Account and Business Manager

 Younghwan Choi
Senior Retail Manager

 Mark Irwin
Management Consultant

 Akif Moroglu
Strategy & Business Development Director

 Guilherme Gomes Martins
Product Management Director

 Joseph Aguayo
Sales Operations & Pricing Manager

 La Terria Dodd
Program Support Specialist

 Rob Kooiker
Group Product Manager HVAC & Fire Protection GMA


